
Add data from Cexplorer.io to your public dashboard (v2)
Tested on Ubutnu 20.04, Grafana 9.1.1, Pormetheus 2.15.2
Inspired by BUFFY page
https://crypto2099.io/adding-pool-stats-to-grafana-dashboard/
Prerequisites- Grafana installed and running
- Prometheus installed and running as service
- Prometheus-node-exporter installed and running as service
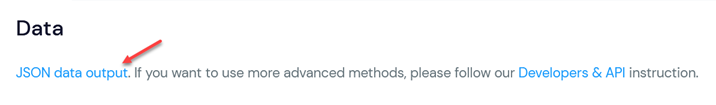
- Copy the JSON link from cexplorer.io
- Prometheus can only use numeric data, so we must first trim the JSON file.
cd /$NODE_HOME or < YOUR NODE FULL PATH >
mkdir -p cexplorer
cd cexplorer
echo "curl https://https://js.cexplorer.io/api-static/pool/pool< YOUR POOL ID >.json 2>/dev/null \
| jq '.data | del(.pool_id, .name, .pool_id_hash, .handles, .twitter_handle, .telegram_handle, .homepage, .url, .img, .updated, .stats)' \
| tr -d \\\"{},: \
| awk NF \
| sed -e 's/^[ \t]*/cexplorer_/' > cexplorer.prom" > getstats.sh
chmod +x getstats.sh
./getstats.sh
- Look at cexplorer.prom content
You should have something like...nano cexplorer.prom
cexplorer_lvlup_stake 655823108193
cexplorer_lvlup_stake_active 653982951884
cexplorer_lvlup_tax_ratio 0
cexplorer_lvlup_tax_fix 340000000
cexplorer_lvlup_blocks_epoch 0
cexplorer_lvlup_blocks_lifetime 95
cexplorer_lvlup_roa_short 4.544
... - Configure promethues-node-exporter.service to grab data from cexplorer.io file. Note that you can run getstats.sh on any other server running node-exporter, you don't have to do it on same server running prometheus.service.
Change ExecStart line for
sudo cp /lib/systemd/system/prometheus-node-exporter.service /lib/systemd/system/prometheus-node-exporter.service_backup sudo nano /lib/systemd/system/prometheus-node-exporter.serviceReload daemon and restart servicesExecStart=/usr/bin/prometheus-node-exporter --collector.textfile.directory=< YOUR NODE FULL PATH >/cexplorer --collector.textfile
sudo systemctl daemon-reload
sudo systemctl restart prometheus-node-exporter.service
sudo systemctl restart prometheus.service
- Assuming Grafana and Prometheus are active and running, you can now add data coming directly from ADApools to your public dashboard. Let's add the active stake.
- Add a new panel.

- From Prometheus datasource, select Metrics, cexplorer, cexplorer_total_stake.

- Data from the pledge, active_stake and total_stake are lovelaces, you must divide by 1 000 000 to get ADA.

- Add a title to your panel, choose visualization template and don't forget to tick Instant if you don't want the graph.

- Set thresholds to change color.

- Save and that's it.


- Add a new panel.
- Set cron job to update data from Cexplorer.io everyday.
Add those linescrontab -e
#Get data from cexplorer.io every day at 00:00
0 0 * * * cd < YOUR NODE FULL PATH >/cexplorer/ && ./getstats.sh
Now, you can create any panel you want with all data from Cexplorer.io.

 *
*  *
**Would like to...but not my data.


