
Set alert rules and notifications by email to Grafana (v1.0)
Tested on Ubutnu 20.04, Grafana 7.4.3, Pormetheus 2.15.2
Prerequisites- Grafana installed and running
- Prometheus installed and running as service
- E-mail account
Set Email notifications
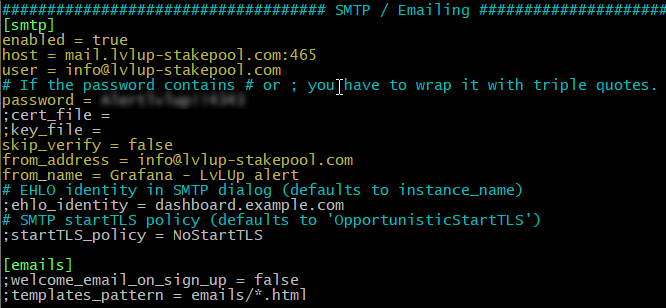
- Enable SMTP configuration in grafana.ini
sudo cp /etc/grafana/grafana.ini /etc/grafana/grafana.ini_backup
sudo nano /etc/grafana/grafana.ini
Scroll down to SMTP section and set those variables.
enabled = true
host = mail.lvlup-stakepool.com:465
user = info@lvlup-stakepool.com
password = < YOUR EMAIL PASSWORD >
skip_verify = false
from_address = info@lvlup-stakepool.com
from_name = Grafana - LvLUp alert
Restart Grafana
sudo systemctl restart grafana-server.service
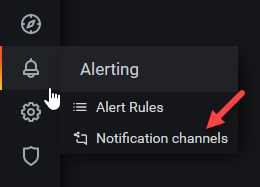
- On your Grafana instance, create a new notification channel.
Click on New channel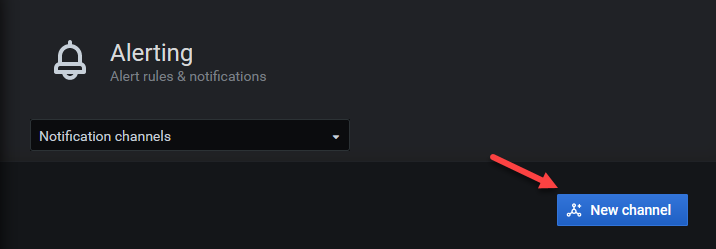
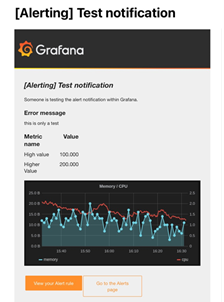
- Add a channel name, choose type Email and add email addresses you want to receive notifications. Before saving, test your new channel.
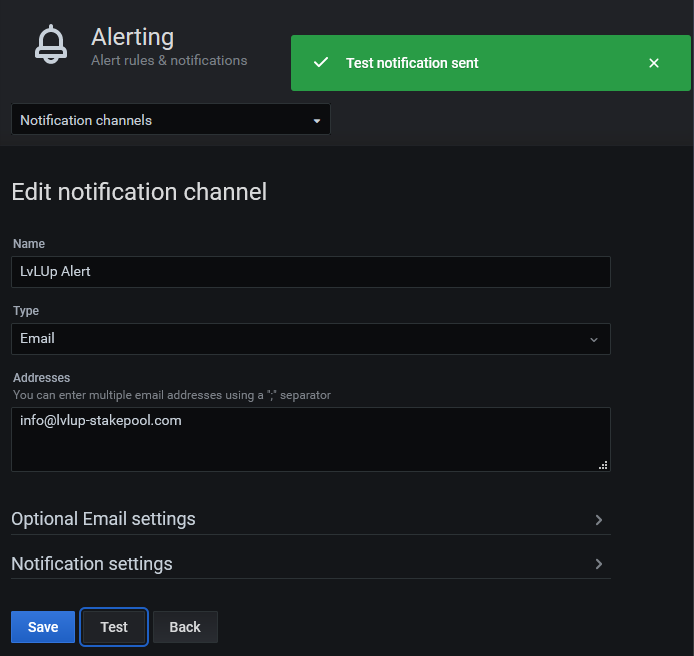
- Check your Email, you should have received a notification test.
If the test fail, go back and check your configuration file grafana.ini. - You can now add an Alert rule to a panel.
Alert rules are not available for all types of panels, panel with query like node_load can.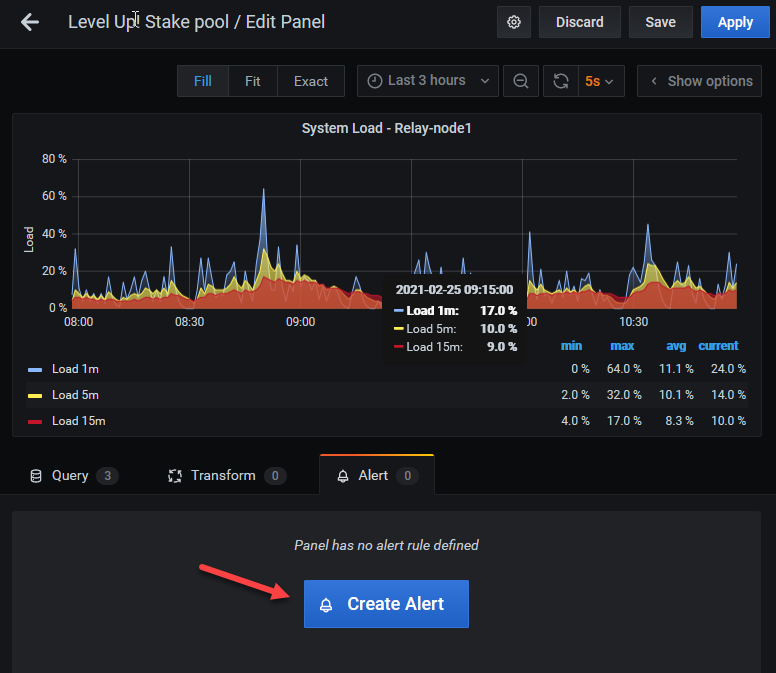
- Set condition to 90% and add your Email notification channel. On this panel, notifications will be sent every time CPU load goes above 90%.
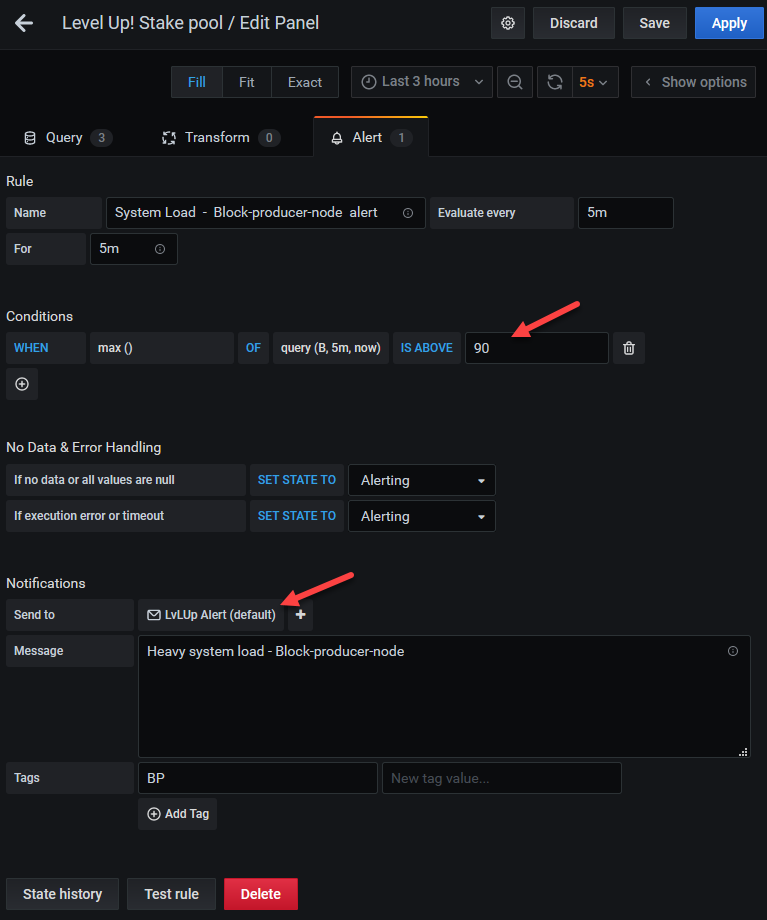
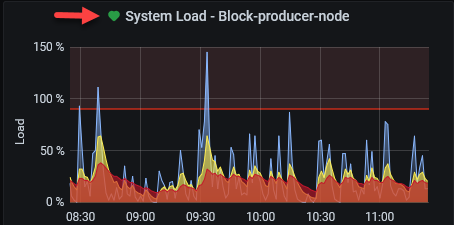
Click on Save button. - When you see a green heart, that means your alert rule conditions are met. If not, you will receive notification by email and you will see a broken red heart.

You can add the plugin Grafana-image-render if you want to see a nice graph in notifications.
sudo grafana-cli plugins install grafana-image-rendererIf you want to know more about alert rules, you can browse the official Grafana documentation.


